
Search engine optimization (SEO) takes time, effort, and constant improvement. But without clear reporting, it’s difficult to know whether your SEO strategy is actually working.
That’s where an SEO reporting dashboard becomes essential.
Instead of digging through multiple tools and spreadsheets, a dashboard brings all your SEO data into one place. It helps marketers, business owners, and agencies quickly understand performance, identify opportunities, and make smarter decisions.
In this guide, you’ll learn what an SEO reporting dashboard is, why it matters, and how to build one that actually delivers insights.
What Is an SEO Reporting Dashboard?
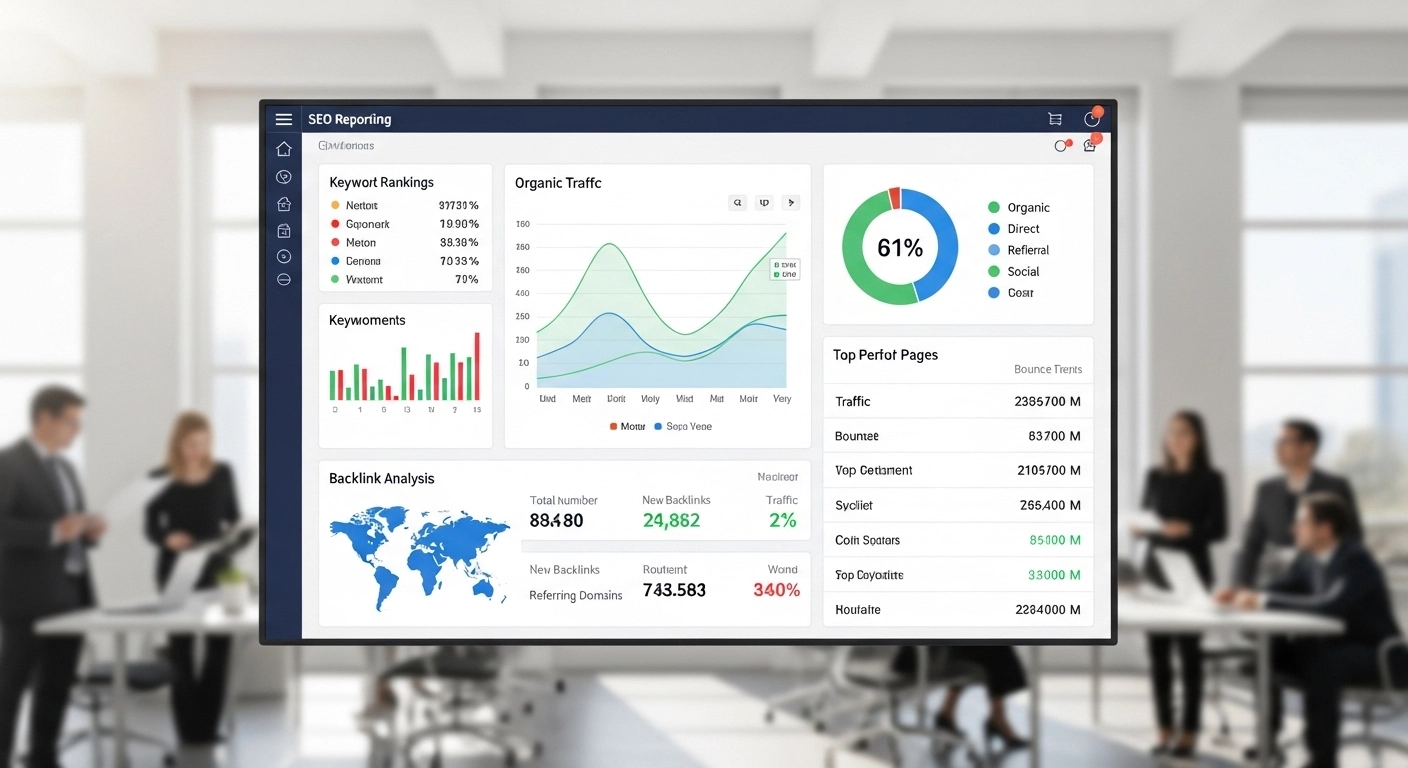
An SEO reporting dashboard is a visual interface that displays key SEO metrics in one place. It pulls data from different sources—such as analytics tools, keyword trackers, and search platforms—and organizes it into charts, graphs, and tables.
The goal is simple: make SEO performance easy to understand at a glance.
Instead of manually collecting data from several tools, the dashboard automatically shows:
- Organic traffic trends
- Keyword rankings
- Click-through rates (CTR)
- Backlink growth
- Top-performing pages
- Technical SEO issues
For marketers and agencies, this means less time creating reports and more time improving SEO strategy.
Why an SEO Reporting Dashboard Is Important
SEO involves many moving parts. Without a clear overview, it’s easy to miss important trends.
A well-designed dashboard helps you:
1. Track SEO Performance in Real Time
You can immediately see whether traffic, rankings, or conversions are improving or declining.
2. Identify Opportunities Faster
Dashboards highlight which pages, keywords, or content pieces are performing well—and which need improvement.
3. Save Time on Reporting
Instead of building reports manually every week or month, the dashboard updates automatically.
4. Communicate Results Clearly
Charts and visuals make it easier to show SEO results to clients, managers, or stakeholders.
Key Metrics Every SEO Reporting Dashboard Should Include
Not all metrics matter equally. A strong SEO dashboard focuses on actionable data, not vanity metrics.
Here are the most important ones to include.
Organic Traffic
This shows how many visitors come to your website from search engines.
Look for trends such as:
- Monthly growth
- Traffic spikes after publishing content
- Traffic drops after algorithm updates
Keyword Rankings
Track the positions of your most important keywords in search results.
Important indicators include:
- Average ranking position
- Number of keywords in the top 10
- New keywords gaining visibility
Click-Through Rate (CTR)
CTR shows how often users click your website after seeing it in search results.
Low CTR may mean:
- Weak page titles
- Unclear meta descriptions
- Strong competitors in the results
Backlink Profile
Backlinks remain a major ranking factor. Your dashboard should track:
- Total backlinks
- Referring domains
- New and lost links
- Domain authority trends
Top Landing Pages
Identify which pages bring the most organic traffic.
This helps you:
- Understand what content works
- Optimize high-performing pages
- Replicate successful content strategies
Conversions from Organic Traffic
Traffic alone isn’t enough. Track how SEO contributes to business goals such as:
- Sales
- Leads
- Sign-ups
- Downloads
Tools Commonly Used to Build an SEO Reporting Dashboard
Most dashboards combine data from multiple SEO tools.
Popular options include:
1. Google Looker Studio
A free dashboard builder that connects easily with many SEO data sources.
2. Google Analytics
Tracks website traffic, user behavior, and conversions.
3. Google Search Console
Shows keyword impressions, clicks, CTR, and indexing issues.
4. SEO Platforms (Ahrefs, Semrush, Moz)
Provide keyword rankings, backlink data, and competitor insights.
When combined, these tools create a powerful SEO reporting system.
How to Build an Effective SEO Reporting Dashboard
A good dashboard focuses on clarity and usefulness.
Follow these best practices:
Start With Business Goals
Before adding metrics, ask:
- What does success look like?
- Are we focused on traffic, leads, or sales?
Your dashboard should reflect those goals.
Keep It Simple
Too many charts can overwhelm users. Focus on the metrics that matter most.
Use Visuals
Graphs and trend lines make data easier to interpret than raw numbers.
Automate Data Updates
Connect your dashboard directly to data sources so reports update automatically.
Segment Important Data
For deeper insights, break down performance by:
- Device (mobile vs desktop)
- Country or region
- Page categories
- Keyword groups
Example of a Simple SEO Reporting Dashboard
A basic dashboard might include:
Section 1: Traffic Overview
- Total organic traffic
- Month-over-month growth
- Top traffic sources
Section 2: Keyword Performance
- Number of ranking keywords
- Keywords in top 3, top 10, and top 20
Section 3: Content Performance
- Top landing pages
- Average engagement time
- Bounce rate
Section 4: Backlink Growth
- New backlinks acquired
- Total referring domains
Section 5: Conversions
- Leads from organic search
- Conversion rate
With this structure, anyone can quickly understand SEO performance.
Common SEO Dashboard Mistakes to Avoid
Many dashboards fail because they focus on data instead of insights.
Avoid these mistakes:
Tracking too many metrics
More data does not mean better reporting.
Ignoring business impact
Traffic alone is meaningless if it doesn’t drive results.
Not updating regularly
SEO trends change quickly. Your dashboard must stay current.
Using unclear visuals
Charts should be simple and easy to read.
FAQ: SEO Reporting Dashboard
What is the purpose of an SEO reporting dashboard?
An SEO reporting dashboard centralizes SEO data so you can easily track performance, identify opportunities, and report results to stakeholders.
What tools are used to create SEO dashboards?
Common tools include Google Looker Studio, Google Analytics, Google Search Console, and SEO platforms like Ahrefs or Semrush.
How often should SEO reports be reviewed?
Most teams review dashboards weekly for monitoring and monthly for detailed reporting.
What is the most important SEO metric?
There is no single metric, but organic traffic, keyword rankings, and conversions are usually the most valuable indicators of SEO success.
Conclusion
An SEO reporting dashboard turns complex SEO data into clear, actionable insights. Instead of jumping between multiple tools and spreadsheets, you can monitor traffic, rankings, backlinks, and conversions from a single view.
When designed correctly, a dashboard does more than report numbers—it helps you make smarter SEO decisions, improve strategy, and prove the value of your work.