
An SEO reporting dashboard is more than just a collection of charts and numbers. Done right, it becomes the control center for your entire SEO strategy—showing what’s working, what’s not, and where to focus next.
Whether you’re a business owner, marketer, or SEO specialist, the real challenge isn’t collecting data. It’s turning that data into clear, actionable insight. That’s exactly where a well-built dashboard makes the difference.
Let’s break it down in a practical, no-fluff way.
What Is an SEO Reporting Dashboard?
An SEO reporting dashboard is a visual tool that gathers and displays key SEO metrics in one place. Instead of jumping between tools like Google Analytics, Google Search Console, and keyword trackers, everything is organized into a single view.
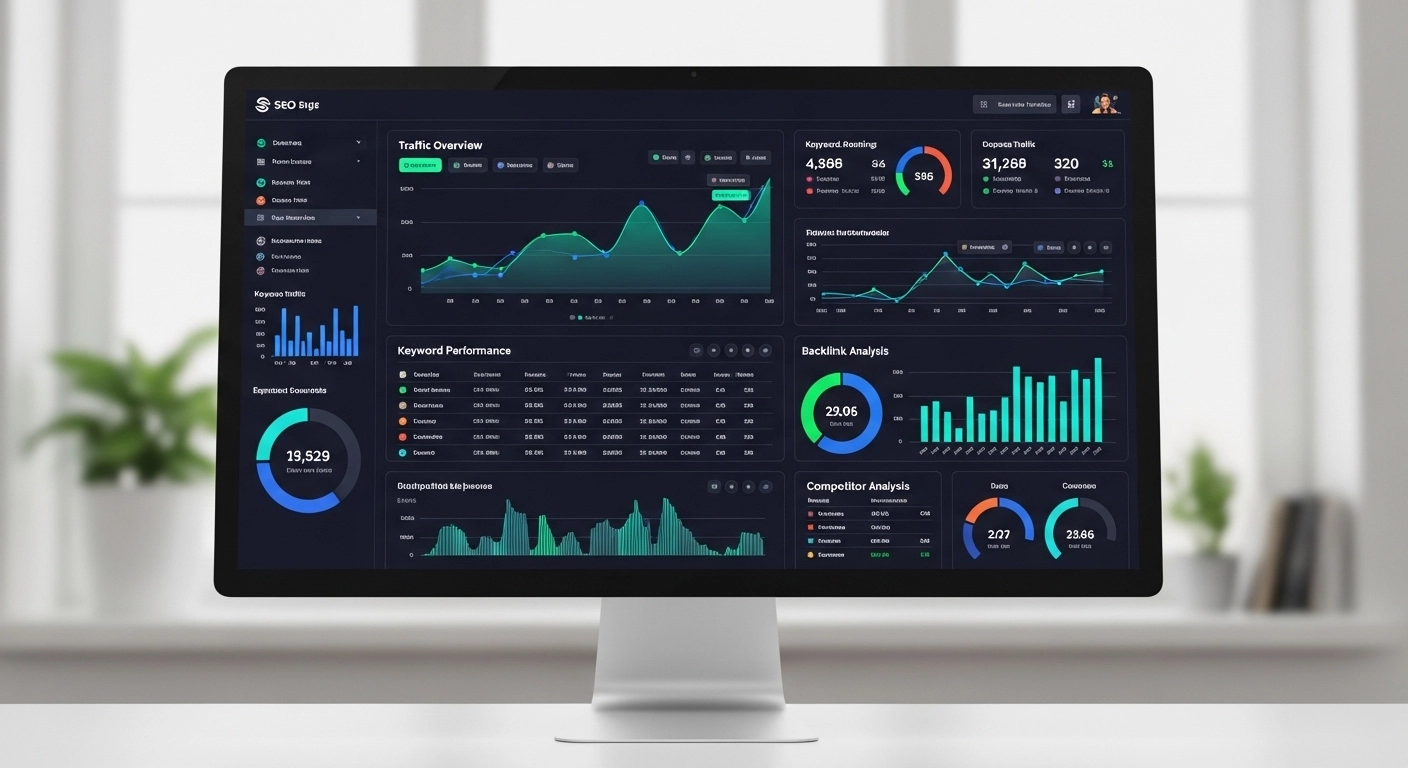
Think of it as your SEO “control panel” showing:
- Organic traffic trends
- Keyword rankings
- Click-through rates (CTR)
- Backlink growth
- Indexed pages
- Conversions from organic search
The goal is simple: help you understand SEO performance at a glance.
Why SEO Reporting Dashboards Matter
SEO without reporting is like driving with your eyes closed. You might be moving, but you have no idea where you’re going.
A strong dashboard helps you:
1. Make faster decisions
Instead of digging through spreadsheets, you instantly see what needs attention.
2. Spot performance issues early
If traffic drops or rankings fall, you catch it before it becomes a bigger problem.
3. Prove ROI
Clients and stakeholders don’t want raw data—they want results. A dashboard translates SEO work into business impact.
4. Track progress over time
SEO is long-term. Dashboards show trends, not just snapshots.
Key Metrics Every SEO Reporting Dashboard Should Include
A good dashboard isn’t about showing everything—it’s about showing what matters.
Here are the essential metrics:
Organic Traffic
This shows how many visitors come from search engines. It’s your primary SEO health indicator.
Keyword Rankings
Track your target keywords to see if your content is moving up or down in search results.
Click-Through Rate (CTR)
Even if you rank well, low CTR means your titles and meta descriptions need improvement.
Backlinks
Quality backlinks still play a major role in authority and rankings.
Landing Page Performance
Which pages bring in the most traffic? Which ones convert?
Conversions from Organic Search
Traffic is good—but conversions are better. This connects SEO to real business results.
Types of SEO Reporting Dashboards
Not all dashboards are built the same. Depending on your goal, you may need different types.
1. Executive SEO Dashboard
Designed for decision-makers. Focuses on high-level KPIs like traffic, leads, and ROI.
2. SEO Performance Dashboard
Used by SEO teams to track rankings, technical health, and content performance.
3. Client SEO Dashboard
Simplified reports for agencies. Easy-to-read visuals that show progress without overwhelming details.
4. Content SEO Dashboard
Focuses on blog performance, keyword clusters, and content engagement.
How to Build an Effective SEO Reporting Dashboard
You don’t need to overcomplicate it. The best dashboards are clean, focused, and easy to interpret.
Step 1: Define your goals
Ask: What decisions should this dashboard help me make?
If it’s traffic growth, prioritize organic sessions. If it’s sales, focus on conversions.
Step 2: Choose your tools
Popular tools include:
- Google Looker Studio (free and flexible)
- Google Analytics 4
- Google Search Console
- Ahrefs or SEMrush
Step 3: Pick the right KPIs
Avoid vanity metrics. Focus only on what impacts performance.
Step 4: Visualize data clearly
Use:
- Line charts for traffic trends
- Bar charts for keyword comparisons
- Tables for ranking changes
Step 5: Keep it simple
A cluttered dashboard is worse than no dashboard at all.
Common Mistakes to Avoid
Many SEO dashboards fail because they try to do too much.
Here are the most common mistakes:
- Tracking too many metrics
- Ignoring business goals
- Not updating data regularly
- Overcomplicating visuals
- Focusing only on rankings instead of conversions
Remember: clarity beats complexity.
Real-World Example
Let’s say you run an e-commerce store.
Your SEO reporting dashboard might show:
- 35% increase in organic traffic month-over-month
- Top-performing keyword: “running shoes for men”
- Product page conversion rate: 2.8%
- 15 new backlinks from blogs
- 3 pages driving 70% of traffic
With this view, you instantly know:
- What’s growing
- What’s converting
- What needs improvement
No guessing. Just decisions.
SEO Reporting Dashboard Tools You Can Use
Here are commonly used tools depending on your level:
- Google Looker Studio – Best free dashboard builder
- Google Analytics 4 – Traffic and behavior tracking
- Google Search Console – Keyword and indexing data
- Ahrefs / SEMrush – Advanced SEO insights
- AgencyAnalytics – Client reporting automation
Each tool plays a different role, but they work best when combined.
FAQ: SEO Reporting Dashboard
What is the main purpose of an SEO reporting dashboard?
It helps you track, visualize, and understand SEO performance in one place so you can make faster decisions.
How often should I update my SEO dashboard?
Weekly or monthly updates work best depending on how fast your SEO strategy changes.
Do I need paid tools to build one?
No. Tools like Google Looker Studio and Search Console are enough for a solid dashboard.
What is the most important SEO metric to track?
It depends on your goal, but organic traffic and conversions are usually the most important.
Can beginners use SEO dashboards?
Yes. In fact, beginners benefit the most because it helps them understand SEO performance clearly.
Conclusion
An SEO reporting dashboard isn’t just a reporting tool—it’s a decision-making system. When built properly, it removes confusion, highlights opportunities, and keeps your SEO strategy focused on results instead of noise.
The key is not to track everything, but to track what truly matters.